Lisp Debugger
Ribbon: Advanced > Lisp > Lisp Debugger
It is possible, to debug a LISP program in CADEditorX User Interface with a built-in LISP debugger. To run the debugger, click the Lisp Debugger button on the ribbon (Advanced tab -> Lisp).
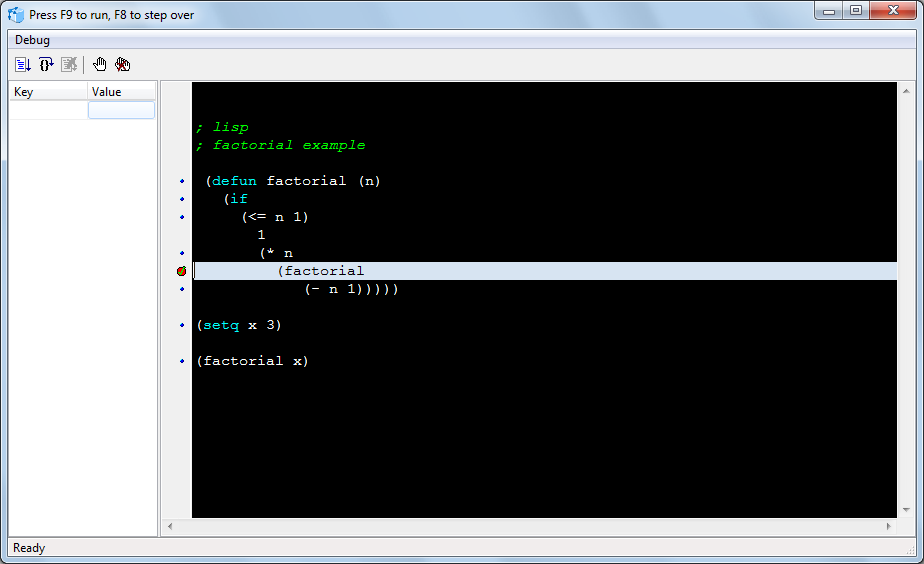
The built-in LISP debugger provides the essential functionality to expose the details of your program's operation.
Press [F9] to run a program
Press [Esc] to pause
Press [Ctrl+F2] to stop the programm.
You can also toggle breakpoints and execute a program step-by-step by pressing [F8].
Go to CADEditorX